Change legend symbols to filled circles
Arguments
- data
A single row data frame containing the scaled aesthetics to display in this key.
- params
A list of additional parameters supplied to the geom.
- size
Scaled size of key circle
Examples
library(ggplot2)
p <- ggplot(economics, aes(date, psavert, fill = "savings rate"))
# key glyphs can be specified by their name
p +
geom_point(
shape = 21,
key_glyph = "dubois")
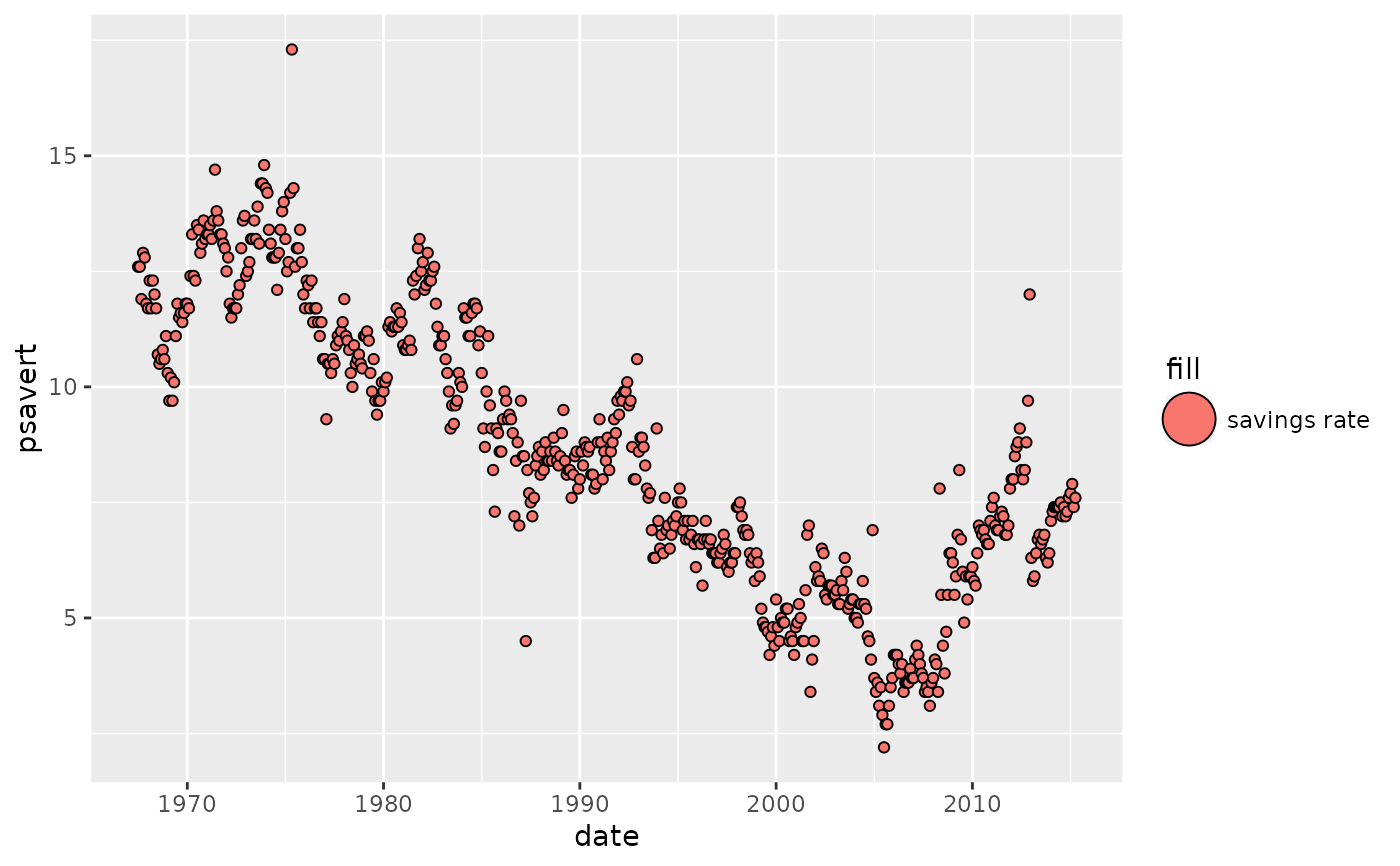 # key glyphs can be specified via their drawing function
p +
geom_point(
shape = 21,
key_glyph = draw_key_dubois)
# key glyphs can be specified via their drawing function
p +
geom_point(
shape = 21,
key_glyph = draw_key_dubois)
