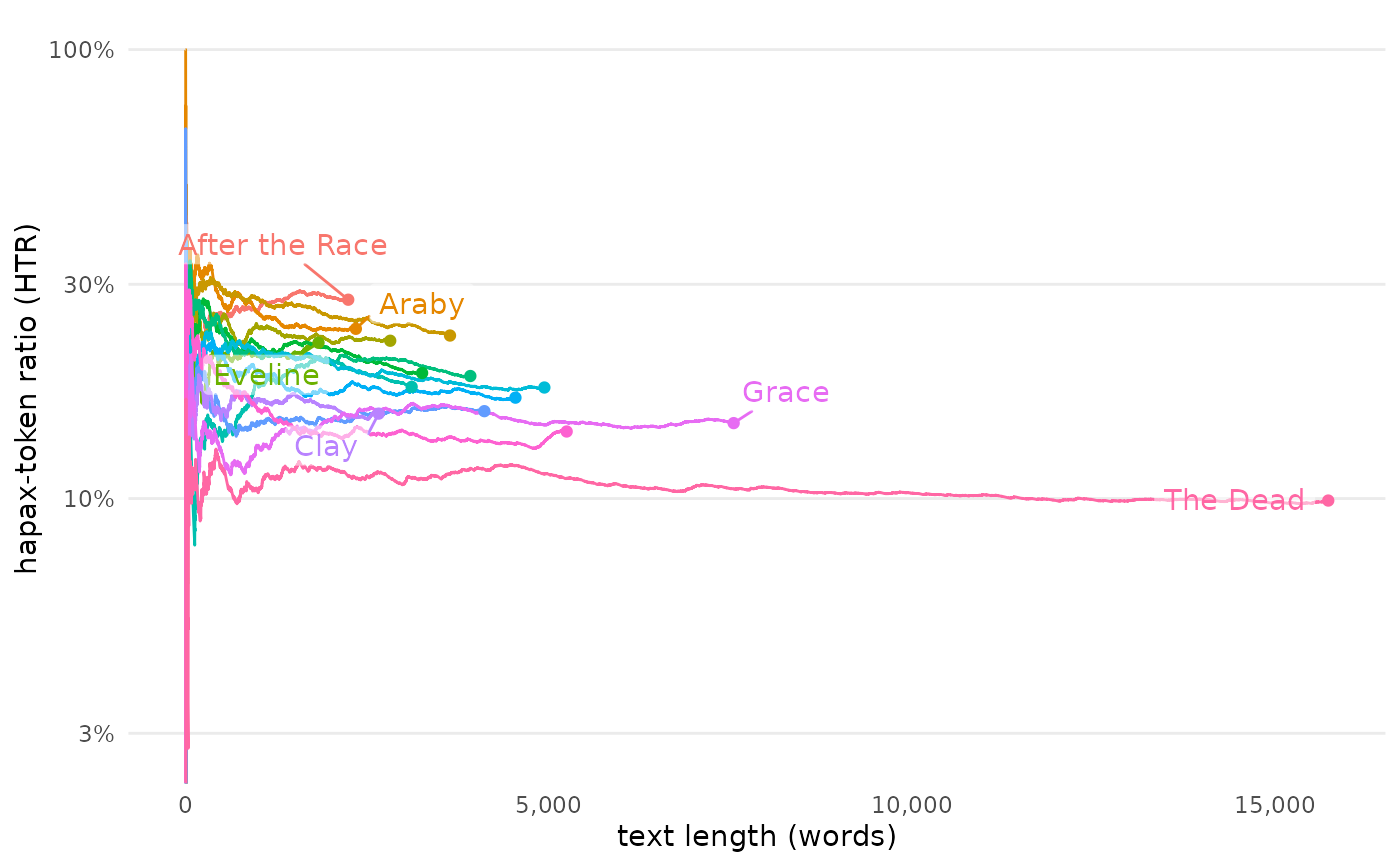
Show hapax-token ratio over time
Usage
plot_htr(
  df,
  x = progress_words,
  by = doc_id,
  identity = doc_id,
  descriptive_labels = TRUE,
  labeling = c("point", "inline", "axis", "inset"),
  log_y = TRUE
)
Arguments
- df
A tidy data frame, potentially containing a column called "doc_id" and "word"
- x
The progress column to show. Default option is progress_percent, but progress_words is also appropriate.
- by
A grouping column for colors and labels
- identity
A grouping column for lines
- descriptive_labels
A toggle for disabling descriptive labels of progress_percent on the X-axis
- labeling
Options for labeling groups:
"point"labels the final value"inline"prints the label within a smoothed curve"axis"prints labels where a secondary Y-axis might go"inset"prints a legend within the plot areaAnything else prints a legend to the right of the plot area.
- log_y
A toggle for logarithmic scaling to the Y-axis; defaults to TRUE
See also
Other visualizing helpers:
change_colors(),
plot_bigrams(),
plot_doc_word_bars(),
plot_doc_word_heatmap(),
plot_hapax(),
plot_tf_idf(),
plot_topic_bars(),
plot_topic_distributions(),
plot_topic_wordcloud(),
plot_ttr(),
plot_vocabulary(),
visualize()
Examples
dubliners <- get_gutenberg_corpus(2814) |>
  load_texts() |>
  identify_by(part) |>
  standardize_titles()

dubliners_measured <- dubliners |>
  add_vocabulary()

dubliners_measured |>
  standardize_titles() |>
  plot_htr()