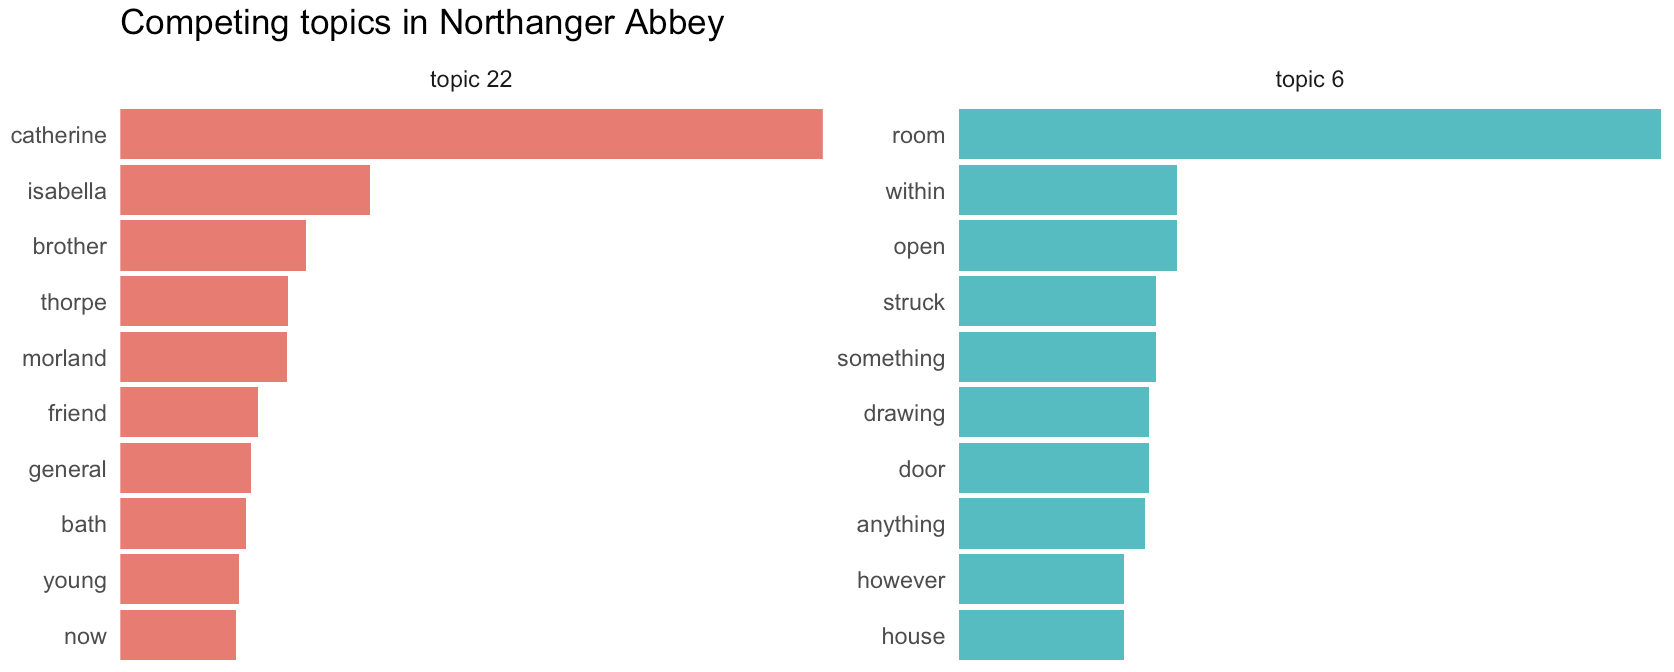
Plot bars for words in each topic
Usage
plot_topic_bars(
  lda,
  topics,
  top_n = 10,
  expand_bars = TRUE,
  save = TRUE,
  saveas = "png",
  savedir = "plots"
)
Arguments
- lda
The topic model to be used.
- topics
The topic numbers to view
- top_n
The number of words to show for each topic
- expand_bars
Whether to stretch the bars the length of the X-axis for each facet
- save
By default, the visualization will be saved. Set to FALSE to skip saving.
- saveas
The filetype for saving resulting visualizations. By default, the files will be in "png" format, but other options such as "pdf" or "jpg will also work.
- savedir
The directory for saving output images. By default, this is set to "plots/".
Examples
austen <-
  get_gutenberg_corpus(c(105, 121, 141, 158, 161, 946, 1342)) |>
  dplyr::select(doc_id = title, text)

austen_lda <-
  austen |>
  make_topic_model(k = 30)

austen_lda |>
  plot_topic_bars(topics = c(22, 6)) +
  labs(title = "Competing topics in Northanger Abbey")